
5 Key Takeaways
- Coverage ratio is the fastest read on whether you have enough reps for the market you claim to be addressing.
- Territory coverage ratio compares serviceable market (accounts the company can realistically pursue) workload with productive seller capacity.
- Divide serviceable accounts or workload units by fully productive equivalent reps.
- A lower ratio creates focus but may leave serviceable accounts uncovered.
- Using all CRM accounts in the numerator or all budgeted seats in the denominator makes the ratio look precise while overstating both market and capacity.
Your territory shapes your accounts, workload, pipeline, customer relationships, quota, earnings, and opportunity to advance. Coverage ratio is the fastest read on whether you have enough reps for the market you claim to be addressing. This guide shows what you should check, what evidence to request, and which questions to bring to your manager. You can use them without becoming the territory designer yourself.
BoogieBoard treats territory coverage ratio as part of a governed change process. The model must connect market strategy with account-level evidence, productive capacity, explicit decision rights, and controlled activation. The objective is not to remove judgment. It is to make judgment visible and repeatable.
The central position is: Do not start with fairness, start with coverage. The sections below turn that position into definitions, alternatives, procedures, examples, controls, and an operating decision.
Working Definitions
- coverage ratio: a comparison of serviceable market workload with productive seller capacity.
- capacity planning: the process of matching productive role capacity to market coverage.
- Territory Viability: whether a book provides enough serviceable opportunity for its assigned role.
- accounts per rep: a defined input used when evaluating territory coverage ratio.
- productivity baseline: a defined input used when evaluating territory coverage ratio.
The framework reflects BoogieBoard's consulting work and interviews with more than 300 companies. It is practitioner evidence used to form hypotheses, not a controlled causal study. For territory coverage ratio, use that observation only for the claim and population it directly supports.
Independent evidence provides a separate check for territory coverage ratio: SMU research on seller reactions to territory design examines the parameters that shape perceptions of fairness and workload.
What Is Territory Coverage Ratio?
Territory coverage ratio compares serviceable market workload with productive seller capacity. The denominator should use productive capacity, not approved headcount, and the numerator should include only accounts the role can realistically cover. The useful distinction is between data, policy, and judgment. Data describes the accounts and roles. Policy states the repeatable rule. Judgment chooses among legitimate tradeoffs. When those layers are blended in a spreadsheet formula or a private manager request, territory coverage ratio becomes difficult to explain and impossible to audit consistently. In territory coverage ratio, test the choice against capacity planning, then record any accepted exception in the decision log. You should be able to trace the result from your account roster to the published rule.
Territory coverage ratio is a governed coverage decision, not a label applied after accounts have already moved. It connects coverage ratio, capacity planning, and Territory Viability to a defined role and market. The output should tell stakeholders what is being decided, which evidence is allowed, who approves exceptions, and how the result will be operated after launch. The territory coverage ratio review is complete only when Territory Viability and the affected account roster tell the same story. If your territory is an outlier, ask whether the difference is intentional, temporary, or a data error.
Calculating and Testing Territory Coverage Ratio
A market contains 1,200 qualified commercial accounts and eight fully productive AEs, producing 150 accounts per AE. Two ramping sellers at 50% productivity raise effective capacity to nine and lower the ratio to 133. Assume six comparable territories cover 900 serviceable accounts. A count-only split begins at 150 accounts each. The team then measures coverage ratio, capacity planning, and Territory Viability; one territory holds 28% of high-potential accounts and another carries twice the near-term workload. The worked answer is not to force identical counts. It is to publish the priority, range, and tradeoff. The territory coverage ratio review is complete only when Territory Viability and the affected account roster tell the same story. If your territory is an outlier, ask whether the difference is intentional, temporary, or a data error.
Create three scenarios. Scenario A minimizes movement, Scenario B minimizes variance on the primary goal, and Scenario C protects continuity while improving the two largest outliers. Compare complete territories after qualifying locks return. Select the scenario whose residual imbalance leadership is prepared to explain and operate. Use one current-state baseline to keep every territory coverage ratio scenario comparable. Your manager should be able to explain the tradeoff without relying on a private spreadsheet.
Start With the Business Objective
Divide serviceable accounts or workload units by fully productive equivalent reps. Calculate separate ratios by role and segment, then test whether the implied accounts per rep fit the selling motion. The control at this stage is a decision log. Separate factual corrections from policy exceptions, preserve rejected alternatives, and attach an effective date. For your territory, the practical test is whether another informed person could reproduce the result from the same data and rules without relying on private context. Use one current-state baseline to keep every territory coverage ratio scenario comparable. Your manager should be able to explain the tradeoff without relying on a private spreadsheet.
Start With the Business Objective means producing one inspectable decision before advancing. Name the input, owner, output, and approval. Keep the current state as a baseline, and record assumptions that could change the result. This dependency order prevents a late preference from rewriting earlier definitions without anyone seeing the cost. For territory coverage ratio, name the approver, the permitted evidence, and the condition that would justify a departure from the rule. Check how the decision changes your workload, pipeline, customer continuity, and quota context.
Define Roles and Comparable Populations
Define Roles and Comparable Populations means producing one inspectable decision before advancing. Name the input, owner, output, and approval. Keep the current state as a baseline, and record assumptions that could change the result. This dependency order prevents a late preference from rewriting earlier definitions without anyone seeing the cost. For territory coverage ratio, name the approver, the permitted evidence, and the condition that would justify a departure from the rule. Check how the decision changes your workload, pipeline, customer continuity, and quota context.
Validate Account and Capacity Data
The control at this stage is a decision log. Separate factual corrections from policy exceptions, preserve rejected alternatives, and attach an effective date. For your territory, the practical test is whether another informed person could reproduce the result from the same data and rules without relying on private context. Keep account-level results beside the territory coverage ratio summary so capacity planning remains inspectable after approval. You need an account-level correction path when the source data does not match what you know.
How to Measure the Result: Territory Coverage Ratio
A lower ratio creates focus but may leave serviceable accounts uncovered. A higher ratio expands nominal coverage while reducing the attention available to each account. Measure the components before combining them. Report distributions for coverage ratio, capacity planning, and Territory Viability, then show the spread, median, outliers, and acceptable range. A composite score can support comparison, but it should never hide the account attributes and assumptions that produced it. Give the territory coverage ratio decision a source date, an owner, and a condition that would trigger revision. Ask what evidence would cause leadership to revisit your territory after activation.
Decision Note: coverage ratio
Using all CRM accounts in the numerator or all budgeted seats in the denominator makes the ratio look precise while overstating both market and capacity. A practical test is to pick one surprising account and trace it end to end. Explain why it is in the segment, why it belongs in the territory, whether it is locked, which goals it affects, and what happens when the seller changes. If the answer requires several private spreadsheets, the model is not yet governed. Before activating territory coverage ratio, show managers the effect on Territory Viability and every downstream rule that depends on it. Your review should focus on documented facts and rules, not a negotiation for preferred accounts.
Where the Model Changes Decisions: Territory Coverage Ratio
The strategic question is what the company believes creates a healthy path to market. Translate that belief into measurable Balance Goals, then test it through scenarios. The model is a hypothesis: it should be specific enough to guide a decision and humble enough to be revised when evidence changes. For territory coverage ratio, document the effect on coverage ratio before the model advances. For your book, ask which accounts move and which measure justifies the change.
See Codex in the Planning Workflow
The relevant product workflow is Fill Vacant AE and BDR Seats with Codex. BoogieBoard Scenario Planning keeps the account-level assumptions, tradeoffs, and proposed assignments visible while the team completes that work.
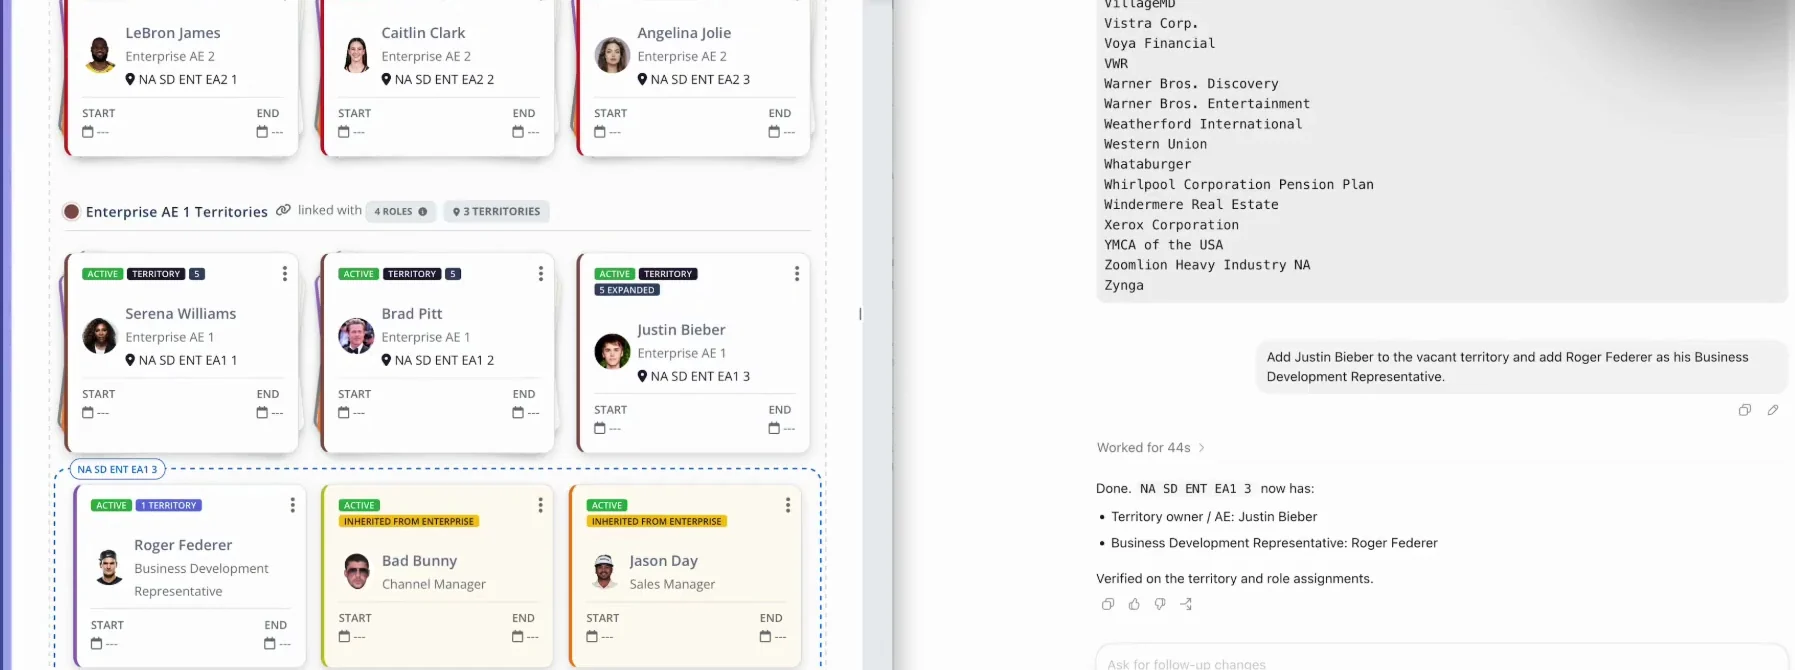
Codex applies a natural-language territory instruction and returns the updated role-assignment model for review.
capacity planning: The Decision Test
A practical test is to pick one surprising account and trace it end to end. Explain why it is in the segment, why it belongs in the territory, whether it is locked, which goals it affects, and what happens when the seller changes. If the answer requires several private spreadsheets, the model is not yet governed. In territory coverage ratio, test the choice against capacity planning, then record any accepted exception in the decision log. You should be able to trace the result from your account roster to the published rule.
Territory Viability: The Decision Test
Use this module to make the hidden decision explicit. State the role, population, evidence, rule, exception path, and operating consequence. The objective is not a perfectly clean model; it is a model whose compromises are visible enough to approve, communicate, and improve. The territory coverage ratio review is complete only when Territory Viability and the affected account roster tell the same story. If your territory is an outlier, ask whether the difference is intentional, temporary, or a data error.
accounts per rep: The Decision Test
A practical test is to pick one surprising account and trace it end to end. Explain why it is in the segment, why it belongs in the territory, whether it is locked, which goals it affects, and what happens when the seller changes. If the answer requires several private spreadsheets, the model is not yet governed. Use one current-state baseline to keep every territory coverage ratio scenario comparable. Your manager should be able to explain the tradeoff without relying on a private spreadsheet.
Common Failure Modes: Territory Coverage Ratio
The common failure is optimizing the easiest field rather than the business objective. Equal account count, a generic revenue band, or one summed score can look objective while concealing fit, workload, timing, hierarchy, and service obligations. Convenience is not a rationale. For territory coverage ratio, name the approver, the permitted evidence, and the condition that would justify a departure from the rule. Check how the decision changes your workload, pipeline, customer continuity, and quota context.
Decision Note: productivity baseline
A practical test is to pick one surprising account and trace it end to end. Explain why it is in the segment, why it belongs in the territory, whether it is locked, which goals it affects, and what happens when the seller changes. If the answer requires several private spreadsheets, the model is not yet governed. Keep account-level results beside the territory coverage ratio summary so capacity planning remains inspectable after approval. You need an account-level correction path when the source data does not match what you know.
Systems and Tooling: Territory Coverage Ratio
Technology should preserve the model, not only the final owner field. Test version control, current-to-future comparison, account-level inspection, locks, scenario assumptions, approvals, effective dates, CRM deployment, and audit history. A faster spreadsheet export is not the same as a governed planning system. Give the territory coverage ratio decision a source date, an owner, and a condition that would trigger revision. Ask what evidence would cause leadership to revisit your territory after activation.
Decision Worksheet
| Decision | Evidence to inspect | Control |
|---|---|---|
| Define the population | coverage ratio and comparable roles | Named data owner |
| Measure the current state | capacity planning and Territory Viability | Source date and baseline |
| Choose the tradeoff | Scenario comparison and complete Territory Health (the measured condition of the complete territory) | Recorded approver |
| Activate the result | Account roster, changes, quota, and transition rules | Effective date and correction path |
What This Means for You
You do not need to rebuild the model to evaluate territory coverage ratio. Check whether your accounts match the published population, whether your workload and opportunity are measured with understandable inputs, whether locked accounts remain in the final comparison, and whether your quota reflects material territory differences. Bring account IDs and evidence when you find an error.
Questions to Ask Your Manager
- What business objective drove this decision, and what tradeoff did leadership accept?
- Which rules determine the accounts and customers in my territory?
- Which Balance Goals were used, and what range is considered acceptable?
- Which accounts were locked, and are they included in the final Territory Health result?
- How does my quota account for potential, workload, capacity, and ramp?
- Where do I submit a data correction or policy challenge, and when will I receive an answer?
Frequently Asked Questions
What is a good coverage ratio?
Territory coverage ratio compares serviceable market workload with productive seller capacity. The denominator should use productive capacity, not approved headcount, and the numerator should include only accounts the role can realistically cover. A lower ratio creates focus but may leave serviceable accounts uncovered. A higher ratio expands nominal coverage while reducing the attention available to each account. Use the published definitions and complete-territory result instead of relying on one universal benchmark. Ask your manager to show how that standard applies to your book.
How do you calculate accounts per rep?
Divide serviceable accounts or workload units by fully productive equivalent reps. Calculate separate ratios by role and segment, then test whether the implied accounts per rep fit the selling motion. A market contains 1,200 qualified commercial accounts and eight fully productive AEs, producing 150 accounts per AE. Two ramping sellers at 50% productivity raise effective capacity to nine and lower the ratio to 133. Publish the assumptions so another reviewer can reproduce the answer. You should be able to reproduce the answer from your roster and the stated inputs.
What data is required for territory coverage ratio?
For territory coverage ratio, assemble governed account data, current assignments, role capacity, and decision evidence for coverage ratio, capacity planning, and Territory Viability. Date the sources and publish the definitions so another reviewer can reproduce the result and separate a factual correction from a policy exception. Request the source date when the underlying account facts look stale.
How often should territory coverage ratio be reviewed?
Review territory coverage ratio on the formal planning cadence and whenever the inputs behind coverage ratio, capacity planning, and Territory Viability change materially. Keep customer and pipeline ownership stable between reviews; reopen the model when strategy or new evidence changes the decision, not merely because a manager prefers a different assignment. Ask when your territory will next receive a formal review.
How should Balance Goals and account locks work together?
For territory coverage ratio, define Balance Goals tied to coverage ratio, capacity planning, and Territory Viability before applying locks. Then publish Account Locking Criteria, lock only qualifying accounts, optimize the movable book, and score the complete territory so locked burden and residual imbalance remain visible. Check that your locked accounts remain in the final health calculation.
When should a spreadsheet be replaced with a planning system?
For territory coverage ratio, a spreadsheet remains adequate while one owner can preserve coverage ratio, capacity planning, and Territory Viability, plus versions, account detail, approvals, and deployment without manual reconciliation obscuring the rule. Move to a planning system when scenario volume, collaboration, or audit work overwhelms the decision itself. You need a system when manual reconciliation makes the rule impossible to inspect.
About the author: Kevin Davis is Co-Founder & CEO of BoogieBoard.
In Summary
Coverage ratio is the fastest read on whether you have enough reps for the market you claim to be addressing. Use the sequence above to keep the decision governed, evidence-based, and inspectable at both the account and territory levels.
See Territory Planning in Practice
Watch practical territory-design workflows on the BoogieBoard YouTube channel.