5 Key Takeaways
- Territory size is not one number. It combines account load, account potential, workload, hierarchy complexity, and the coverage capacity of each role.
- In BoogieBoard's observed designs, prospect loads rise much faster down-market than customer books, and the same job title can represent radically different work.
- Segment labels are not standardized. Publish the underlying employee, revenue, named-account, or industry-specific rules before comparing territory benchmarks.
- Equal account counts can still produce inequitable territories. Use Balance Goals (measurable design objectives) to test potential, workload, account mix, customer obligations, and disruption together.
- Calculate coverage from the serviceable account universe and role capacity, then validate the answer through scenarios before changing live assignments.
If you are comparing your territory with a benchmark, a single average can mislead you about your workload, pipeline, customers, and opportunity to earn. The useful question is harder: average for which role, segment, motion, and definition of an account?
Across BoogieBoard's work, a Strategic AE may cover a handful of complex account families while an SMB AE works hundreds of prospects. A CSM may own a concentrated Enterprise book or participate in a pooled queue of thousands. These are not outliers around one universal benchmark. They are different coverage systems.
Territory fatalism is a choice. If a patch sits far outside a relevant range, that is a design decision somebody made, not a fact of nature.
The Core Components of Territory Size
Account Load
Account load is the number of customers, prospects, or corporate families assigned to a role. Always separate customer and prospect books. Existing customers carry renewal, adoption, support, and relationship obligations that raw account count does not show.
Potential and Workload
Two books with 50 accounts can have different revenue potential, buying complexity, renewal timing, intent, travel, and stakeholder requirements. Territory size therefore needs several Balance Goals, not account count alone.
Coverage Ratio
Coverage ratio connects the serviceable account universe to available capacity:
Coverage ratio = serviceable accounts / productive role capacity
If 2,000 qualified prospects require an average workable load of 200 per AE, the model needs ten fully productive AE territories before overlays, ramp, vacancies, or protected accounts are considered.
Research has long treated workload and sales potential as core territory-design variables, and seller satisfaction with territory design is linked to motivation, job attitudes, and performance outcomes (Grant, Cravens, Low, and Moncrief). A benchmark is operationally useful because the design affects real work, not because average counts are inherently fair.
Average Territory Size by Role and Segment
The following ranges come from territory designs and practitioner work observed by BoogieBoard. They are starting points, not universal standards.
Account Executive Customer Books
| Segment | Customer accounts per AE |
|---|---|
| Strategic | 1-5 |
| Enterprise | 5-20 |
| Mid-Market | 25-40 |
| SMB | 40-100 |
Customer books stay relatively concentrated because each account carries ongoing obligations. The underlying corporate family may also be much larger than the visible account count suggests.
Account Executive Prospect Books
| Segment | Prospect accounts per AE |
|---|---|
| Strategic | 1-15 |
| Enterprise | 15-100 |
| Mid-Market | 100-300 |
| SMB | 250-1,000 |
Prospect load grows roughly 65 times from Strategic to SMB. That steep change reflects lower per-account research and selling depth, not a belief that down-market reps should simply work harder.
BDR Prospect Books
| Segment | Prospect accounts per BDR |
|---|---|
| Strategic | 5-25 |
| Enterprise | 75-300 |
| Mid-Market | 150-500 |
| SMB | 500-1,000 |
Upmarket, BDRs often widen the funnel for a much smaller AE list. Down-market, the BDR and AE may work nearly the same account universe with different responsibilities.
Account Manager and CSM Books
| Role | Strategic | Enterprise | Mid-Market | SMB |
|---|---|---|---|---|
| Account Manager | 1-3 | 5-25 | 25-50 | 40-100 |
| CSM | 1-40 | 10-500 | 100-1,000 pooled | 500-2,000 pooled |
The CSM row is the warning. CSM load can run many times the AM load because pooled and tech-touch service models are fundamentally different from commercial ownership. Do not use one customer-role benchmark for both.
Key Factors That Change the Benchmark
Segment Definition
Segment names describe a selling motion, not a universal company-size classification. In BoogieBoard's observed designs, employee count is the primary boundary for roughly 45-60% of organizations, annual revenue for 20-30%, and a combination for 10-20%.
The modal employee-count model is SMB at 1-99, Mid-Market at 100-999, Enterprise at 1,000-4,999, and Strategic at 5,000+ or named. Actual ranges vary widely: some companies begin Enterprise at 500 employees, others at 5,000.
Strategic is often an override rather than a band. Roughly 55-70% of observed Strategic definitions use a curated named list. Publish that decision before comparing account loads.
The modal revenue model tells a similar story: SMB below $50 million, Mid-Market from $50 million to $999 million, Enterprise from $1 billion to $4.99 billion, and Strategic at $5 billion+ or named. Industry-specific businesses may need AUM, locations, beds, students, vehicles, or another scale measure. Segment definitions should match the selling motion rather than whichever firmographic field is easiest to export.
Sales Motion and Support Model
Inbound volume, BDR support, partner involvement, solutions consulting, self-service, renewal ownership, and product complexity all change workable load. A rep with strong operational support can manage a different book than a rep doing research, prospecting, closing, onboarding, and expansion alone.
Company Structure and Hierarchy
Counting Salesforce records can overstate or understate real workload. One ultimate parent with 40 subsidiaries may require more coordinated work than 40 unrelated SMB prospects. Decide whether the benchmark counts records, ultimate parents, buying groups, or relationships.
Note for Sales Leaders
When a territory is outside the benchmark, do not jump directly to resizing it. Ask which assumption differs: segment definition, role responsibility, customer obligations, account hierarchy (the parent-child structure connecting related companies), selling support, or expected productivity. The explanation matters more than proximity to an average.
Decoding Common Territory Structures
Geographic Territories
Accounts are assigned by country, state, postal code, or proximity. This is useful for physical selling and service, but natural boundaries rarely produce equal potential or workload.
Named-Account Territories
Specific accounts are curated for each rep. This supports Strategic selling, but the selection logic and exception governance become the entire design.
Segment Territories
Accounts are grouped by a shared selling motion such as SMB, Mid-Market, or Enterprise. The segment rule must be visible and consistently applied.
Hybrid Territories
The model combines geography, segment, industry, account status, product, or role. Hybrid designs can match the business closely, but simple account-count balancing becomes actively misleading.
Choose the simplest model that expresses the real constraints. For each dimension, document whether it is a hard eligibility boundary, a soft balancing preference, or only a reporting label.
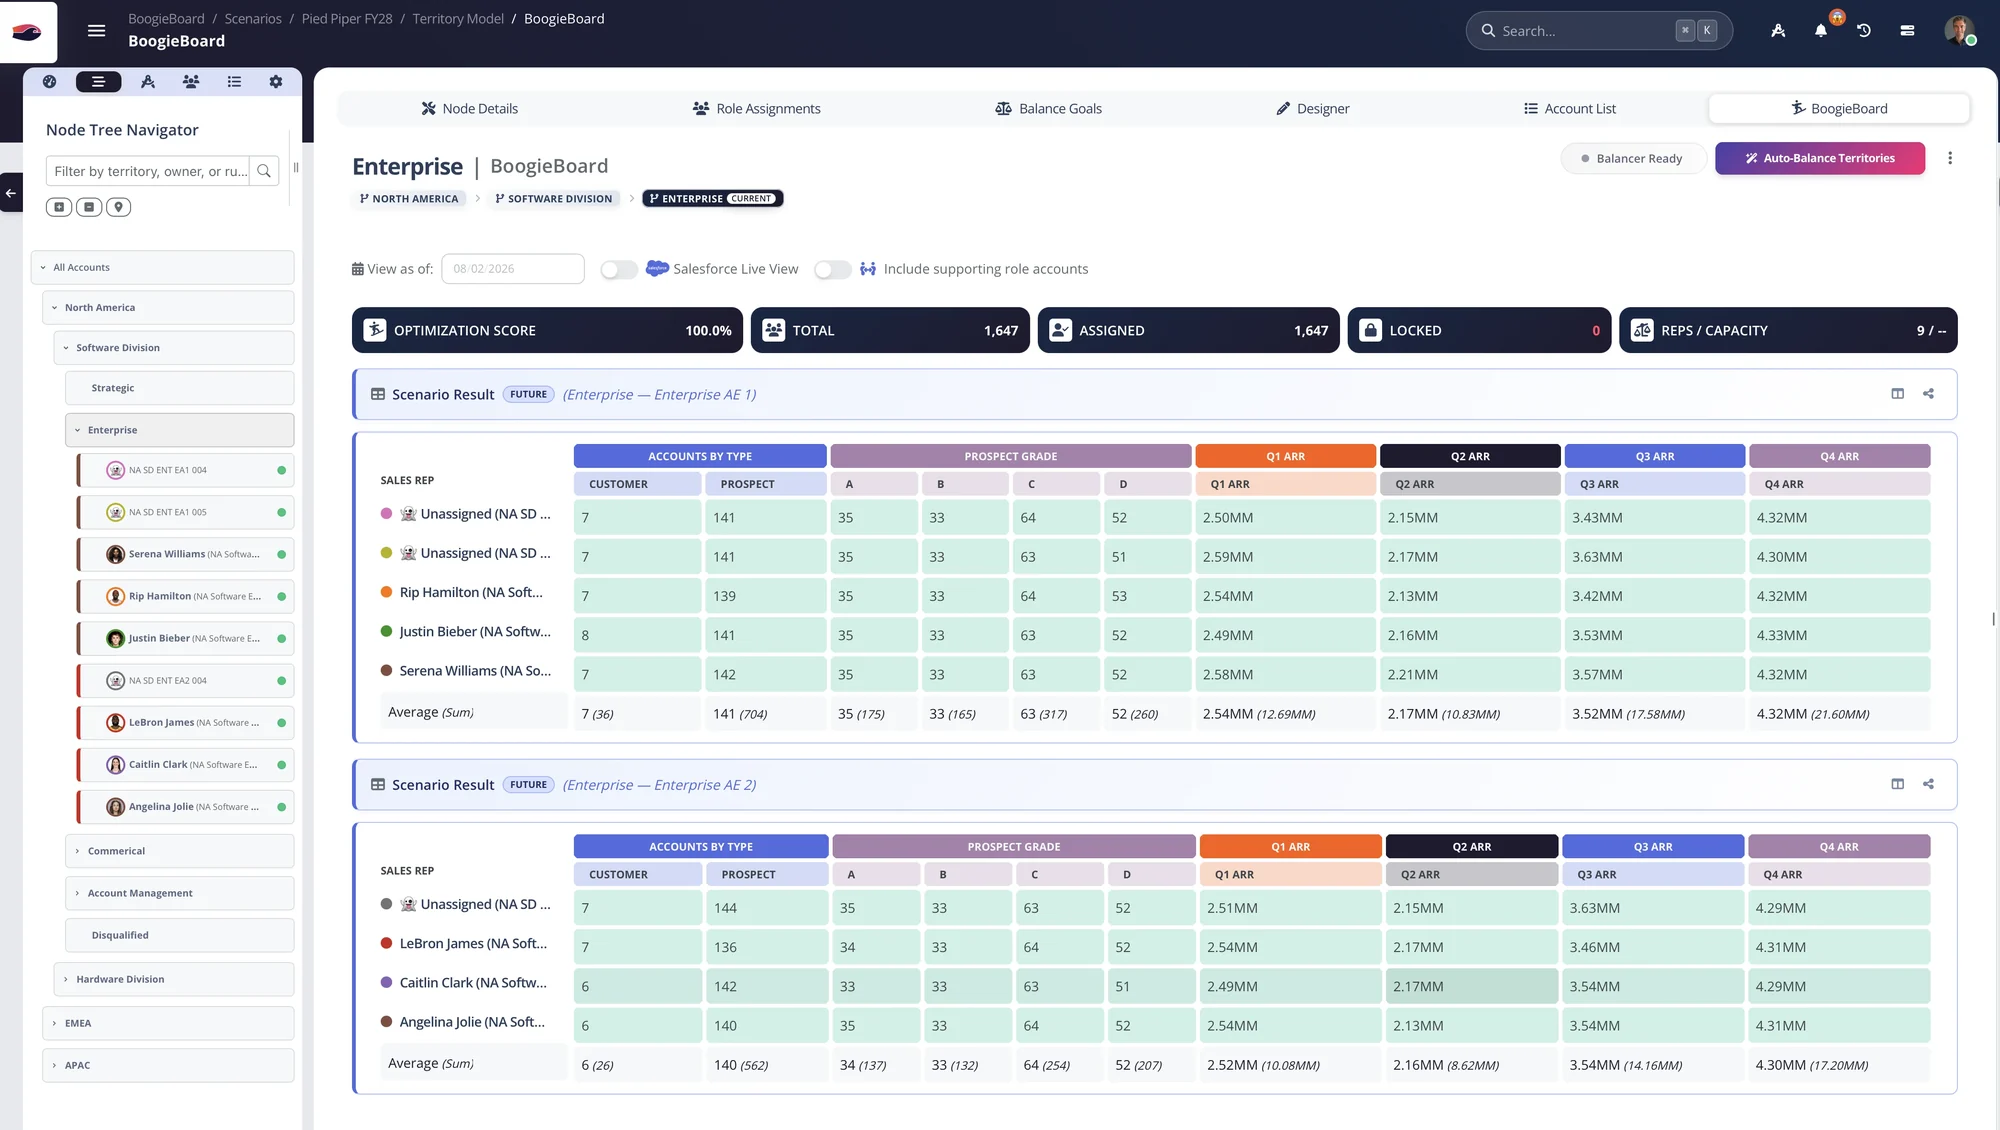
Scenario Results show customer and prospect mix, prospect grade, quarterly ARR, account locks, and rep capacity in one review surface.
BoogieBoard lets operators compare account count with potential, quota relativity, prospect grade, customer ARR, hierarchy, and workload in the same scenario. The point is not to force every territory toward an average. It is to make the tradeoff visible.
How to Calculate and Project Territory Capacity
The Coverage Formula
Use this sequence:
- Define the serviceable account universe using the published segment and ICP rules.
- Remove deliberate exclusions and identify protected customer or opportunity accounts.
- Choose a role-specific workable-load range.
- Divide the account universe by productive capacity.
- Add ramp, vacancy, overlay, and hierarchy assumptions.
- Test the result against several Balance Goals.
Capacity also needs a roster adjustment. Ten viable territories do not imply ten productive reps on day one. Add known vacancies, start dates, ramp curves, leaves, and temporary managers after the durable structure is designed.
Worked Examples
| Motio | Serviceable accounts | Planning load | Base territory count |
|---|---|---|---|
| Enterprise prospects | 800 | 80 per AE | 10 |
| Mid-Market prospects | 2,400 | 200 per AE | 12 |
| Strategic customers | 48 families | 4 per AM | 12 |
The calculation produces a capacity hypothesis. Scenario design determines whether those territories are viable once potential, hierarchy, customer continuity, and staffing are applied.
Warning: The Hidden Complexity
A benchmark built on stale revenue, inconsistent employee counts, duplicate accounts, or missing parent relationships creates false precision. State the data source, refresh cadence, segment rule, and counting unit beside the result.
Average territory size is valuable only when it makes assumptions easier to inspect. Use the ranges to challenge a model, not to avoid designing one.
How to Evaluate Whether the Benchmark Fits Your Territory
You do not need to accept or reject a territory because it falls inside one observed range. Use the benchmark to ask better questions about the work.
1. Rebuild the Denominator
Ask what the published count includes. Separate customers, active prospects, low-priority prospects, subsidiaries, pooled records, and accounts excluded from the current motion. If your book contains 300 records but only 120 are expected to receive named outreach, the operational load is different from a 300-account Target Account List.
2. Compare the Role, Not the Title
Two AEs may have different work. One owns prospecting, renewal, and expansion. Another receives BDR support and transfers customers after close. Compare your responsibilities, support, and required service level before comparing counts.
3. Inspect Potential and Workload Together
A Balance Goal is a measurable design objective, such as comparable high-fit account counts or customer workload. Ask which goals shaped your book and how close the final assignments are to the approved ranges. A smaller territory may contain more opportunity or more complex customer work. A larger one may require lighter-touch coverage.
4. Check Account Hierarchy
An account hierarchy is the parent-child structure connecting related companies. Decide whether a corporate family counts as one strategic relationship or many local selling entities. If the model splits related accounts among sellers, understand the coordination and credit rules before interpreting the total.
5. Identify Temporary Exceptions
Vacancies, ramping hires, protected opportunities, mergers, and strategic-account decisions can move a book outside its normal range. Your manager should be able to state why the exception exists, who owns the extra work, and when the territory will be reviewed.
Questions to Ask Your Manager
Bring evidence, not a generic request for fewer accounts:
- Which segment definition produced this benchmark, and does it match our market?
- Which accounts are expected to receive active coverage this period?
- What support roles, automation, and inbound flow were assumed?
- What does healthy Territory Health mean here? Territory Health is the measured condition of the book against its selected opportunity and workload standards.
- Which customers or opportunities are locked, and how were they counted in the complete book?
- What event would trigger a capacity or assignment review?
Ask your manager to compare your actual book with the benchmark at the account level. You should be able to see which of your accounts are customers, which are active prospects, which belong to the same parent, and which require exceptional work. Then ask how your support, your quota, and your expected activity differ from the role represented by the range. Without that context, the number cannot describe your capacity.
You should also ask how the company will learn. If the benchmark assumes 150 workable prospects but sellers consistently reach only 90 with the required research depth, that is useful capacity evidence. If the best-fit tier produces little pipeline, the issue may be the ICP hypothesis rather than account count.
The goal is not to negotiate toward the smallest book. It is to secure a territory you can execute: enough credible opportunity, a workload that fits the role, clear priorities, and a governed path when the underlying facts are wrong.
A Worked Seller Comparison
Imagine two Mid-Market AEs with 220 prospects each. Your book contains 80 high-fit accounts, 40 active signals, and no customer renewals. The other book contains 45 high-fit accounts, 20 signals, and 25 customers requiring expansion and renewal work. Equal count has hidden both opportunity and workload.
A better review compares component measures, not one summed score. Leadership may move some high-fit prospects, change the customer obligation, adjust support, or accept a visible difference because of qualified locks. Whatever the choice, the complete result should be explained before quota and performance are interpreted.
Read the Benchmark as a Range, Not a Promise
Observed ranges describe territory designs BoogieBoard has encountered. They do not establish a universal optimum or guarantee that a book inside the range is healthy. The sample reflects different companies, definitions, data quality, products, support models, and stages of maturity.
Use three layers when presenting a benchmark:nn| Layer | What to disclose | Why it matters to you |n|---|---|---|n| Definition | Role, segment, customer/prospect status, family treatment | Confirms that the comparison is relevant |n| Distribution | Range, common thresholds, and material outliers | Prevents one average from hiding variation |n| Validation | Workload, pipeline, customer outcomes, and seller feedback | Tests whether the assumption fits the motion |
A company adopting a benchmark should set a review period. For a new role or segment, compare expected and actual activity after ramp. Measure how many accounts received meaningful coverage, where customer obligations consumed capacity, and whether high-fit accounts produced pipeline. Keep the findings at the component level.
Do not shrink a book simply because sellers contacted fewer accounts than expected; poor prioritization or enablement may be the cause. Do not expand it simply because activity automation increased; research depth or customer work may remain the limiting constraint. The benchmark begins the capacity conversation. Your observed work completes it.
Document the review date so today's range does not become a permanent rule.
Before you leave the review, confirm what happens next. Will your book change, will your support or priorities change, or will the company accept the visible exception? Ask when your territory will be measured again and what evidence you should bring. A benchmark helps only when you can connect it to your work and use it to improve your coverage conditions.
Your manager should also tell you who owns the follow-through. If your account data need correction, if your customer workload changes, or if your book remains outside the approved range, you need a named owner and review date rather than another informal promise.
Frequently Asked Questions
What is the average sales territory size?
It varies from a handful of Strategic accounts to hundreds or thousands of SMB prospects. Use role, segment, motion, and account type together; a single blended average is not meaningful.
How is Enterprise defined versus Mid-Market?
A common employee-count model uses 100-999 for Mid-Market and 1,000-4,999 for Enterprise, but observed definitions vary substantially. Publish the actual rule used by your company.
Should every rep have the same number of accounts?
No. Equal counts can be inequitable when potential, workload, hierarchy, and customer obligations differ. Comparable reps need a shared Territory Health definition, not necessarily identical books.
How many accounts can a CSM manage?
Observed loads range from a few Strategic customers to pooled SMB populations of 500-2,000. Service model and responsibility matter more than title alone.
How often should territory-size assumptions be recalculated?
Review them during annual planning and whenever the ICP, product, segment model, staffing plan, or customer motion changes materially.
About the author: Kevin Davis is Co-Founder & CEO of BoogieBoard.
In summary: Territory-size benchmarks are useful when role, segment, motion, hierarchy, and data definitions travel with the number. Use them to form and test a capacity hypothesis.
Watch territory planning in action
See Balance Goals, capacity, and scenario workflows on BoogieBoard's YouTube channel.
Customer proof: Fullstory used multiple equity measures across 12 distinct teams instead of applying one account-count rule globally (read the Fullstory case study).
</callout>